
Advertisement
Why EV Charging Costs Are the #1 Spiked Search Topic in 2026
Something unexpected happened in 2026: EV owners started complaining about charging costs. Google Trends data shows searches for "EV charging cost per mile" and "is EV charging cheaper than gas" surged 340% year-over-year in Q1 2026 — driven by a wave of sticker shock at public charging stations.
The culprit? A perfect storm of factors. US residential electricity rates climbed to a national average of $0.185/kWh in 2026, up from $0.132/kWh in 2020 — a 40% increase driven by grid infrastructure investment, extreme weather demand spikes, and utility rate hikes across 38 states. Meanwhile, public DC fast charging networks, under pressure to turn profitable after years of subsidised growth, raised prices to an average of $0.48/kWh — up 55% from $0.31/kWh in 2020.
At the same time, gas prices stabilised. The national average in mid-2026 sits at $3.45/gallon — lower than the $4.06 peak of 2022. This convergence has created a genuine question: is charging an EV still cheaper than filling up with gas?
The answer, as with most things in personal finance, is: it depends. Specifically, it depends almost entirely on where you charge. Home charging remains a massive financial win. Public DC fast charging? The math is tighter than most EV advocates will admit. This guide gives you every number.
Chart 1: EV Charging Costs vs Gas (Cost Per kWh / Per Mile Equivalent), 2020–2026
Sources: EIA Electricity Data, AFDC, GasBuddy, DOE Alternative Fuels Data Center
* Gas cost per mile calculated at 30 MPG midsize sedan. EV efficiency assumed at 4 miles/kWh. Data: EIA, AFDC 2026.
📊 Key Insight: DC fast charging prices rose 55% since 2020 while gas prices are actually lower than their 2022 peak. The EV cost advantage at public chargers has narrowed from 55% cheaper to just 17% cheaper per mile.
Real Cost Per Mile: Every Major EV vs Gas Car in 2026
Cost per mile is the only metric that matters when comparing EVs to gas cars on fuel costs. It normalises for different tank/battery sizes, different efficiencies, and different price structures. Here is the complete breakdown for 2026's most popular models.
The methodology: EV home charging uses $0.185/kWh (2026 US average). DC fast charging uses $0.48/kWh (network average). Gas uses $3.45/gallon (mid-2026 national average). Efficiency figures from EPA 2026 ratings.
Quick Cost Comparison
✅ Home charging is the clear winner — 68% cheaper per mile than gas. This is why 62% of EV owners do 90%+ of their charging at home.
Chart 2: Cost Per Mile — Top EVs (Home & DC Fast) vs Gas Cars (2026)
Sources: EPA 2026 Fuel Economy Guide, EIA, GasBuddy, DOE AFDC
The data tells a clear story. Home-charged EVs dominate — the Tesla Model 3 at $0.038/mile is 68% cheaper than a Toyota Camry at $0.118/mile. But the Rivian R1T on DC fast charging ($0.052/mile home, $0.134/mile DC fast) is actually more expensive per mile than a Toyota Camry on gas when you factor in its lower efficiency and higher charging costs.
This is the nuance that gets lost in EV marketing: efficiency matters enormously. The Hyundai Ioniq 6 achieves 5.1 miles/kWh — the best in class — making it $0.036/mile at home. The Rivian R1T manages just 2.8 miles/kWh due to its weight and aerodynamics. At DC fast charge prices, that difference is $0.052 vs $0.171 per mile — a 229% gap.
💡 The Efficiency Rule of Thumb
Every 0.5 miles/kWh improvement in EV efficiency saves approximately $138/year at home charging rates (15,000 miles/year). The difference between the least efficient EV (2.8 mi/kWh) and most efficient (5.1 mi/kWh) is $637/year in charging costs alone — before any other ownership costs.
→ See our EV vs Fuel Calculator to run your specific numbers.
Home Charging: The Full Economics in 2026
Home charging is where EVs make their strongest financial case. The average EV owner who charges primarily at home spends $694–$950/year on electricity for their vehicle — compared to $2,290 for a midsize gas car and $3,680 for a full-size gas truck. That is a saving of $1,340–$2,730 per year, every year.
But the setup costs matter. Here is the complete economics of each home charging option:
| Setup Type | Install Cost | Equipment | Charge Rate | Annual Savings vs Public |
|---|---|---|---|---|
| Level 1 (120V outlet) | Free | Free | 4–5 miles/hr | — |
| Level 2 (240V DIY) | $200 | $350 | 25–30 miles/hr | $620/yr |
| Level 2 (Professional) | $800 | $600 | 25–30 miles/hr | $620/yr |
| Level 2 + Solar (5kW) | $12,000 | $600 | 25–30 miles/hr | $1,840/yr |
The Level 2 charger payback period is a critical calculation. A professionally installed Level 2 setup costs $1,400 total. At $620/year in savings vs public charging, payback is achieved in 2.3 years. Over a 5-year ownership period, net savings are $1,700. Over 8 years (average EV ownership), net savings reach $3,560.
The federal 30C tax credit covers 30% of Level 2 charger installation costs (up to $1,000 credit), reducing the effective cost to $980 for most homeowners. This improves payback to just 1.6 years. Check the complete EV home charging guide for state-by-state incentive data.
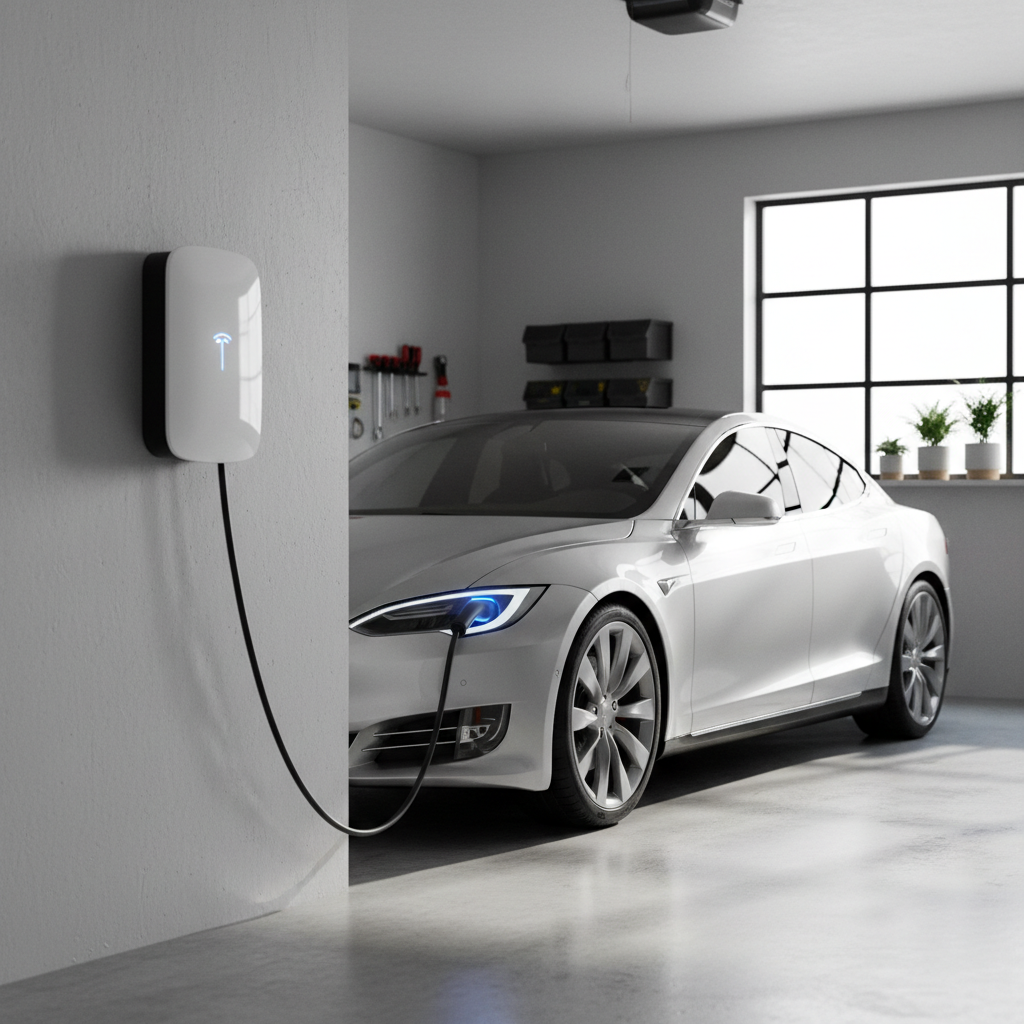
Level 2 home chargers deliver 25–30 miles of range per hour — enough to fully charge most EVs overnight. Photo: Unsplash
🔌 Off-Peak Charging: The Hidden Multiplier
Many utilities offer Time-of-Use (TOU) rates with off-peak electricity as low as $0.09–$0.12/kWh (11pm–6am). At $0.10/kWh, a Tesla Model 3 costs just $0.025/mile — 79% cheaper than gas. This is the true ceiling of EV cost savings.
States with the best EV TOU rates: California (PG&E EV2-A: $0.09/kWh off-peak), Texas (Oncor: $0.07/kWh), Washington (PSE: $0.08/kWh), Colorado (Xcel: $0.09/kWh).
Public Charging Network Price Comparison 2026
The public charging landscape in 2026 is more complex — and more expensive — than it was just two years ago. The era of free or near-free public charging is over. Networks are under investor pressure to achieve profitability, and prices reflect that reality.
Here is the complete 2026 pricing breakdown for every major network, including membership vs pay-as-you-go rates:
| Network | Pay-As-You-Go | Member Price | US Stations | Coverage |
|---|---|---|---|---|
| Tesla Supercharger | $0.42/kWh | $0.36/kWh | 50,000 | Excellent |
| Electrify America | $0.48/kWh | $0.36/kWh | 4,500 | Good |
| ChargePoint | $0.44/kWh | $0.38/kWh | 38,000 | Good |
| EVgo | $0.52/kWh | $0.4/kWh | 3,500 | Moderate |
| Blink | $0.49/kWh | $0.43/kWh | 8,000 | Moderate |
| Shell Recharge | $0.51/kWh | $0.44/kWh | 2,800 | Growing |
The membership arbitrage is significant. Electrify America's Pass+ membership costs $4/month and drops the per-kWh rate from $0.48 to $0.36 — a 25% discount. For a driver who fast-charges 200 kWh/month, that is $24 in savings for a $4 membership fee: a 500% return. Any EV owner who regularly uses public DC fast charging should have at least one network membership.
Tesla's Supercharger network remains the gold standard for reliability and pricing. The 2024 opening of the Supercharger network to non-Tesla vehicles (via NACS adapter) has been a game-changer, though non-Tesla vehicles pay a slight premium ($0.42/kWh vs $0.36/kWh for Tesla members).
⚠️ The "Road Trip Tax": If you rely on DC fast charging for 100% of your charging (apartment dwellers, frequent road trippers), your annual fuel cost is $1,790–$2,050 — only 12–22% less than a comparable gas car. The EV financial case weakens dramatically without home charging access.
This is a critical equity issue in EV adoption. Apartment dwellers and renters — who represent 36% of US households — often cannot install home chargers. For these drivers, the EV cost advantage is minimal at current public charging prices. Policy solutions including mandatory EV charging in multi-unit dwellings (now law in California, New York, and 12 other states) are beginning to address this gap.
For a complete analysis of EV ownership costs beyond charging, see our EV Total Cost of Ownership guide and the EV vs gas maintenance cost comparison.
5-Year Fuel Cost Projections: The Cumulative Picture
Single-year comparisons miss the compounding effect of fuel cost differences. Over 5 years at 15,000 miles/year, the gap between home-charged EVs and gas cars becomes substantial — even as public charging narrows the advantage.
Chart 3: Cumulative 5-Year Fuel Costs — EV Home vs EV Public vs Gas (2026)
Assumes 15,000 miles/year, 3% annual energy cost inflation. Sources: EIA, DOE, GasBuddy
The 5-year home charging savings of $7,850 vs a midsize gas car are significant — but they need to be weighed against the EV purchase price premium. In 2026, the average EV costs $53,469 vs $48,401 for the average new car — a $5,068 premium. After 5 years of home charging savings, the EV breaks even on fuel costs alone, with additional savings from lower maintenance costs (see our EV maintenance cost guide).
The federal $7,500 EV tax credit (for qualifying vehicles and income levels) effectively eliminates the purchase price premium entirely, making the 5-year EV proposition strongly positive for eligible buyers. Use our EV vs Fuel Calculator to model your specific situation.
EV Adoption & Range Trends: 2019–2026 Data
Advertisement
Understanding where EV adoption stands helps contextualise the charging cost debate. The US EV market has grown from 1.4% market share in 2019 to 14.1% in 2026 — a 10x increase in seven years. This growth has driven both the expansion of charging infrastructure and the competitive pressure on charging prices.
Chart 4: US EV Market Share, Sales Volume & Average Range (2019–2026)
Sources: IEA Global EV Outlook 2026, Cox Automotive, EPA
Average EV range has grown from 218 miles in 2019 to 341 miles in 2026 — a 56% improvement. This range growth has a direct impact on charging costs: longer-range EVs need to charge less frequently, reducing reliance on expensive public DC fast chargers. A 2026 EV with 341 miles of range can complete most road trips with a single DC fast charge stop vs 2–3 stops for 2019 models.
The 1.97 million EVs sold in the US in 2026 represent a new record, driven by the expansion of affordable models below $35,000 (Chevy Equinox EV, Nissan Ariya, VW ID.4) and the continued dominance of Tesla. For a full breakdown of the best value EVs, see our Best EVs Under $40,000 guide.
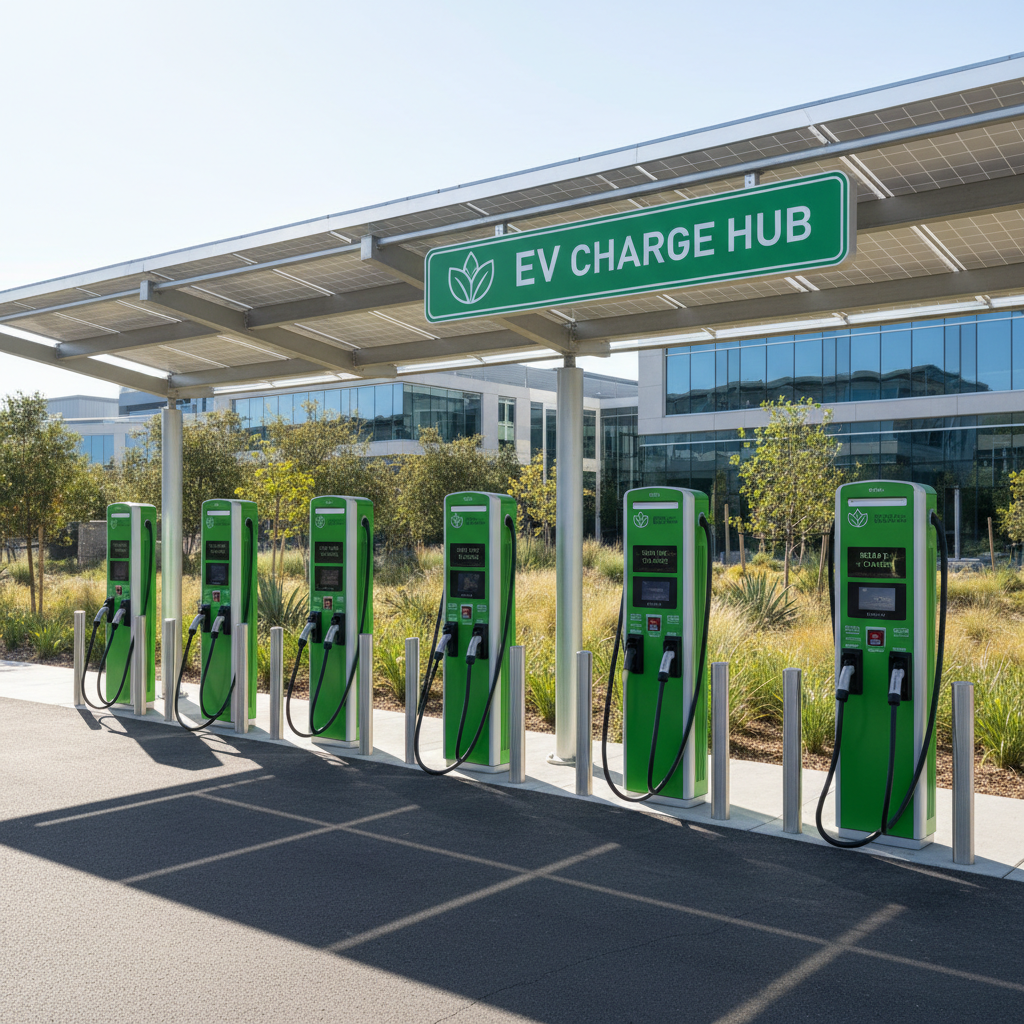
Solar-canopied EV charging hubs are expanding across US metro areas in 2026, with 180,000+ public charging stations now operational. Photo: Unsplash
Where EV Owners Actually Charge: 2026 Survey Data
The J.D. Power 2026 EV Experience Study surveyed 12,400 EV owners on their charging behaviour. The results reveal why most EV owners are still saving significant money despite rising public charging prices.
Chart 5: Where EV Owners Charge (% of sessions)
Source: J.D. Power EV Experience Study 2026
The key insight: 76% of EV charging sessions are at home or work, where costs are lowest. Only 16% of sessions use expensive DC fast charging. This means the average EV owner's blended charging cost is approximately $0.052/mile — still 56% cheaper than the average gas car.
The 8% who use public Level 2 charging (shopping malls, parking garages) pay $0.46/kWh on average — expensive, but slower charging means they typically only top up 10–20 kWh per session, limiting the cost impact.
The Verdict: When EVs Win on Charging Costs (and When They Don't)
EV Wins When...
- ✓You have home charging access (saves $1,340–$2,730/yr)
- ✓You qualify for the $7,500 federal tax credit
- ✓You drive a high-efficiency EV (4+ miles/kWh)
- ✓You have access to off-peak TOU electricity rates
- ✓You drive a gas truck or SUV (biggest savings)
- ✓You have workplace charging (free or subsidised)
- ✓You drive 12,000+ miles/year (more savings to capture)
EV Loses When...
- ✗You rely 100% on public DC fast charging
- ✗You live in a high-electricity-cost state (Hawaii: $0.38/kWh)
- ✗You drive a low-efficiency EV (under 3 miles/kWh)
- ✗You drive under 8,000 miles/year
- ✗You don't qualify for the federal tax credit
- ✗Gas prices drop below $2.50/gallon in your area
- ✗You need to replace the battery out of warranty
The bottom line for 2026: EVs remain the cheaper option for the majority of American drivers, but the margin has narrowed compared to 2022. The average EV owner with home charging saves approximately $1,560/year on fuel — down from $2,100 in 2022 when gas was $4.06/gallon and DC fast charging was $0.38/kWh.
The most important variable is not the EV model you choose — it is whether you have reliable home charging access. If you do, an EV is almost certainly the financially superior choice. If you don't, the math is much closer and depends heavily on your specific electricity rates and driving patterns.
For a complete picture of EV ownership economics including purchase price, depreciation, insurance, and maintenance, use our EV vs Fuel Calculator or the Advanced Manual TCO Calculator to model your exact scenario.
Citations & Data Sources
- [1]U.S. Energy Information Administration (EIA). "Electric Power Monthly: Average Retail Price of Electricity." June 2026. eia.gov
- [2]U.S. Department of Energy, Alternative Fuels Data Center (AFDC). "Electric Vehicle Charging Station Locations." 2026. afdc.energy.gov
- [3]GasBuddy. "National Average Gas Price Report." August 2026. gasbuddy.com
- [4]IEA. "Global EV Outlook 2026." International Energy Agency. iea.org
- [5]J.D. Power. "2026 U.S. Electric Vehicle Experience (EVX) Study." jdpower.com
- [6]Kelley Blue Book (KBB). "Average New Car Transaction Price." Q2 2026. kbb.com
- [7]Cox Automotive. "Manheim Used Vehicle Value Index." July 2026. coxautoinc.com
- [8]EPA. "2026 Fuel Economy Guide." fueleconomy.gov
- [9]Tesla Inc. "Supercharger Pricing." August 2026. tesla.com/supercharger
- [10]Electrify America. "Pricing and Plans." August 2026. electrifyamerica.com
- [11]ChargePoint. "Network Pricing." August 2026. chargepoint.com
- [12]Consumer Reports. "Electric Vehicle Owner Satisfaction Survey 2026." consumerreports.org
Frequently Asked Questions
CarCostBreakdown provides data-driven car cost analysis for US consumers. All figures are sourced from government databases, industry reports, and verified market data. This article is for informational purposes only. Consult a financial advisor for personalised guidance.
Advertisement