
Advertisement
1. The Global Scale of Road Accidents
Road traffic injuries are the leading cause of death for people aged 5–29 globally, according to the World Health Organization's 2023 Global Status Report on Road Safety.[1] Despite decades of safety campaigns, improved vehicle technology, and legislative progress, the annual death toll has remained stubbornly fixed at approximately 1.35 million since 2016 — a figure that represents one death every 23 seconds.
The 2026 data paints a complex picture. High-income countries have made significant progress — road deaths in the European Union fell by 36% between 2010 and 2024 — but these gains are being offset by rising fatalities in low- and middle-income countries (LMICs), which now account for 92% of all road traffic deaths despite owning only 60% of the world's vehicles.
The financial toll is equally staggering. Road crashes cost the global economy an estimated $1.8 trillion annually — roughly 3% of global GDP — through medical costs, lost productivity, emergency response, and infrastructure damage.[2] For low-income nations, this burden can consume up to 3.3% of GDP, diverting resources from education, healthcare, and development.
📊 Key Fact: Road traffic injuries cost the global economy more than the entire GDP of Australia ($1.7T) every single year. Yet road safety receives less than 0.1% of global health funding.
This report draws on data from the WHO, the International Transport Forum (ITF), the Global Burden of Disease Study, NHTSA, and national road safety agencies across 180+ countries. Where 2026 data is not yet available, we use the most recent verified figures with trend projections.

Emergency response at a road accident scene. Photo: Unsplash
2. Regional Breakdown: Where Deaths Are Concentrated
Road fatalities are not distributed evenly. The WHO divides the world into six regions for health data purposes, and the disparities between them are stark. South-East Asia and Africa together account for nearly half of all global road deaths, driven by rapid motorisation, poor road infrastructure, and limited enforcement capacity.
Annual Road Deaths by WHO Region (2024 est.)
Source: WHO Global Status Report on Road Safety 2023, ITF 2024
Africa has the highest road traffic death rate per 100,000 population at 26.6 — more than three times the European rate of 8.3. Rapid urbanisation, a young and growing vehicle fleet, and limited trauma care infrastructure all contribute to this disparity.
South-East Asia records the highest absolute number of deaths, led by India (approximately 153,000 deaths in 2023), Thailand (20,000+), and Indonesia (28,000+). Motorcycle culture, mixed-traffic roads, and inconsistent helmet enforcement are key factors.
Europe has the best safety record globally, with the EU's Vision Zero programme targeting zero road deaths by 2050. Sweden, Norway, and Switzerland consistently record fewer than 3 deaths per 100,000 population — the global benchmark for road safety excellence.
The Americas present a divided picture: the United States recorded 42,795 road deaths in 2022 (12.7 per 100,000) — a rate more than three times higher than comparable high-income nations — while Canada achieved 5.8 per 100,000. Latin America remains a high-risk region, with Brazil, Colombia, and Mexico all recording rates above 15 per 100,000.
Advertisement
3. Fatality Trends 2010–2026
The global road death toll has remained remarkably persistent. The UN's Decade of Action for Road Safety (2011–2020) set a target of halving road deaths — a target that was missed by a wide margin. The successor Stockholm Declaration (2020) set a new target of 50% reduction by 2030, but current trajectories suggest only a 7–10% reduction is achievable without dramatic policy intervention.
Global Road Deaths Trend (millions)
Source: WHO, Global Burden of Disease Study 2024
The temporary dip in 2020 was driven by COVID-19 lockdowns reducing vehicle miles travelled globally by an estimated 30–40%. As mobility recovered in 2021–2022, deaths rebounded sharply — a pattern that underscores how the underlying risk factors remain unchanged.
Notably, the United States bucked the global trend in 2020, recording a 7.2% increase in road deaths despite dramatically reduced traffic — attributed to increased speeding on emptier roads, higher rates of impaired driving, and reduced seatbelt compliance during the pandemic period.[3]
High-income countries that have achieved sustained reductions share common characteristics: comprehensive graduated licensing systems, automated speed enforcement, high seatbelt compliance rates (>95%), and investment in forgiving road design that accounts for human error.

Global vehicle traffic continues to grow, increasing exposure to road risk. Photo: Unsplash
4. Who Dies on the Roads? Vulnerable Road Users
The distribution of road deaths by road user type reveals a critical insight: the most vulnerable road users — pedestrians, cyclists, and motorcyclists — account for more than half of all global road deaths, yet they receive a fraction of road safety investment compared to car occupant protection.
Deaths by Road User Type (2024)
Source: WHO Global Status Report 2023
Motorcyclists represent the single largest category at 28% of all deaths. In South-East Asia, this figure rises to over 40%. The proliferation of affordable motorcycles as primary transport in LMICs — combined with inconsistent helmet laws and poor road surfaces — creates a lethal combination.
Pedestrians account for 26% of global road deaths. In African cities, where formal pedestrian infrastructure is often absent and vehicle speeds are high, pedestrian fatalities can represent over 50% of all road deaths. The WHO estimates that reducing pedestrian death rates to European levels would save over 200,000 lives annually.
Cyclists account for 6% globally but this figure is rising as cycling rates increase in urban areas without corresponding infrastructure investment. The Netherlands, Denmark, and Germany — which have invested heavily in protected cycling infrastructure — demonstrate that cycling can be made safe: Dutch cyclist fatality rates are 80% lower than the global average.
Advertisement
5. The Economic Cost of Road Accidents
The economic burden of road crashes extends far beyond immediate medical costs. A comprehensive accounting includes emergency response, hospitalisation, rehabilitation, lost productivity, legal costs, vehicle damage, and the long-term economic impact on bereaved families. The World Bank estimates the total global cost at $1.8 trillion annually — a figure that has grown by 22% since 2016 as vehicle numbers and economic activity have increased.[4]
Road Crash Cost as % of GDP by Income Group
Source: World Bank, 2024 Road Safety Report
The inverse relationship between income and crash cost burden is particularly troubling. Low-income countries — which have the fewest resources to absorb economic shocks — bear the highest proportional cost at 3.3% of GDP. This creates a vicious cycle: road crashes drain resources needed for the infrastructure improvements that would reduce crashes in the first place.
For individual families, the financial impact of a road crash can be catastrophic. Research from the Global Road Safety Partnership found that in LMICs, a serious road injury can push a family into poverty, with out-of-pocket medical costs averaging 3–5 months of household income. This is directly relevant to our analysis of global car ownership costs — the true cost of a vehicle includes the risk of catastrophic accident-related expenses.
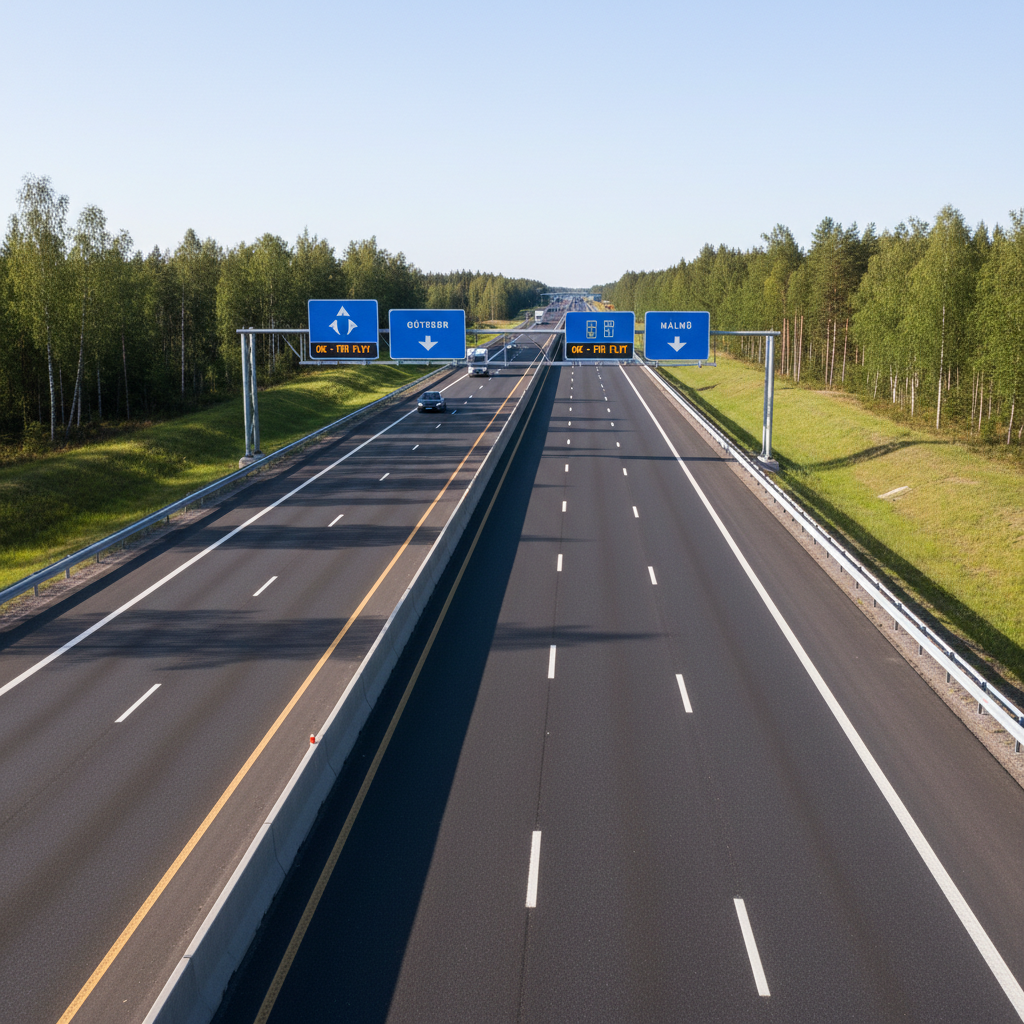
Investment in road infrastructure is one of the most cost-effective safety interventions. Photo: Unsplash
6. Country-by-Country Fatality Rates
Road fatality rates per 100,000 population vary by a factor of 20 between the safest and most dangerous countries. This variation reflects differences in vehicle fleet age, road quality, speed enforcement, healthcare access, and cultural attitudes toward road safety.
Road Deaths per 100,000 Population — Selected Countries (2024)
Source: WHO, ITF Road Safety Annual Report 2025
| Country | Deaths/100K | Annual Deaths (est.) | Risk Category |
|---|---|---|---|
| Norway | 2 | ~110 | Very Low |
| Sweden | 2.2 | ~230 | Very Low |
| Switzerland | 2.5 | ~220 | Very Low |
| Germany | 3.7 | ~3,100 | Low |
| UK | 3.1 | ~2,100 | Low |
| Australia | 4.7 | ~1,200 | Low |
| Canada | 5.8 | ~2,200 | Moderate |
| Japan | 2.6 | ~3,300 | Low |
| USA | 12.7 | ~42,800 | High |
| Brazil | 17.8 | ~38,000 | Very High |
| India | 11.1 | ~153,000 | High |
| China | 7.3 | ~62,000 | Moderate |
| Thailand | 36.2 | ~25,000 | Extreme |
The United States stands out as an anomaly among high-income nations. With a fatality rate of 12.7 per 100,000 — more than four times higher than comparable European nations — the US road safety crisis is driven by a combination of factors: car-dependent urban design, high speed limits on rural roads, inconsistent seatbelt enforcement, and a cultural resistance to automated speed enforcement.
These country-level differences in accident risk are directly reflected in car insurance premiums. American drivers pay an average of $2,014/year for car insurance — nearly three times the European average — partly because the underlying accident risk is genuinely higher.
Advertisement
7. Root Causes: Speed, Alcohol & Infrastructure
Road crashes are not accidents — they are predictable, preventable events with identifiable causes. The WHO identifies five key risk factors that account for the majority of road deaths globally.
A 5% increase in average speed increases crash risk by 10% and fatal crash risk by 20%. Speed is the single largest contributing factor globally.
Driving with a blood alcohol content of 0.05% increases crash risk by 38%. In some regions, alcohol is involved in over 40% of fatal crashes.
Mobile phone use while driving increases crash risk by 4x. Texting while driving is now the leading cause of teen road deaths in the USA.
Seatbelts reduce the risk of death in a crash by 45–60%. Yet in many LMICs, rear-seat seatbelt compliance rates are below 30%.
Motorcycle helmets reduce the risk of death by 42% and serious head injury by 69%. Inconsistent helmet laws cost an estimated 100,000 lives annually.
Roads designed without safety in mind — no barriers, poor lighting, inadequate pedestrian crossings — are a systemic cause of preventable deaths.
Infrastructure quality is an often-overlooked determinant of road safety. The International Road Assessment Programme (iRAP) estimates that 75% of road deaths occur on roads that would fail basic safety standards. Investing in road safety features — rumble strips, median barriers, pedestrian crossings, and improved lighting — delivers a return of $4–$10 for every $1 invested through reduced crash costs.
The relationship between vehicle age and safety is also significant. In high-income countries, the average vehicle age is 8–12 years, and modern vehicles are equipped with advanced safety features including automatic emergency braking (AEB), lane-keeping assist, and electronic stability control. In LMICs, vehicle fleets are often 15–25 years old, lacking these technologies entirely. This is one reason why understanding the true cost of car ownership must include the safety value of newer vehicles.
8. What Works: Evidence-Based Interventions
Road safety is one of the most cost-effective areas of public health investment. The evidence base for effective interventions is robust, and the countries that have achieved the greatest reductions in road deaths have implemented a comprehensive, multi-layered approach known as the Safe System.
Estimated Annual Lives Saved by Intervention (Global)
Source: WHO, OECD Road Safety Compendium 2024
Road design improvements offer the highest potential impact at an estimated 22,000 lives saved annually if implemented globally. The Safe System approach designs roads to be forgiving of human error — accepting that crashes will occur and ensuring they do not result in death or serious injury.
Speed management is the second most impactful intervention. Automated speed cameras have reduced speeding by 20–30% and fatal crashes by 15–20% in every country where they have been rigorously implemented. Sweden's Vision Zero programme — which has reduced road deaths by 80% since 1990 — places speed management at its core.
Seatbelt and helmet legislation with active enforcement delivers rapid results. When Australia introduced mandatory seatbelt laws in 1970 (the world's first), road deaths fell by 18% within two years. Similar results have been replicated in every country that has implemented and enforced these laws.
Vehicle safety standards are increasingly important as global vehicle fleets modernise. The UN's Global Technical Regulations (GTRs) set minimum safety standards for vehicles sold globally. Mandatory AEB systems — which can prevent up to 38% of rear-end crashes — are now required in new vehicles sold in the EU, USA, and Australia. Extending these requirements to all markets could save an estimated 9,000 lives annually.

Electric vehicles are equipped with advanced safety technology that could reduce accident rates. Photo: Unsplash
9. EVs & Road Safety: The Emerging Picture
The rapid global transition to electric vehicles — with EV market share reaching 35% of new car sales in 2026 — has significant implications for road safety. The evidence so far is broadly positive, though with important nuances.
EVs are, on average, safer than equivalent ICE vehicles in crash tests. Their lower centre of gravity (due to floor-mounted battery packs) reduces rollover risk, and their structural rigidity is enhanced by the battery housing. NHTSA data shows that EVs have a 40% lower fatality rate per vehicle mile travelled than the average ICE vehicle — though this partly reflects the demographic profile of EV owners rather than the vehicles themselves.
However, EVs present new safety challenges. Their near-silent operation at low speeds creates a pedestrian detection problem — studies show a 37% higher pedestrian strike rate for EVs vs ICE vehicles in urban environments below 30 km/h. This has led to mandatory acoustic vehicle alerting systems (AVAS) in the EU and USA, which emit a synthetic sound at low speeds.
The weight of EVs is also a concern. The average EV weighs 400–600 kg more than an equivalent ICE vehicle due to battery mass. Research from the Insurance Institute for Highway Safety (IIHS) found that heavier vehicles impose greater forces on lighter vehicles in crashes, potentially increasing fatalities in mixed-fleet collisions.
Advanced driver assistance systems (ADAS) — which are standard on most new EVs — offer the greatest safety benefit. Automatic emergency braking, blind spot monitoring, and lane-keeping assist collectively reduce crash rates by 20–35%. As the global fleet transitions to EVs, the widespread adoption of these technologies could deliver a significant reduction in road deaths. For a full analysis of EV costs and benefits, see our EV vs fuel cost calculator and our guide to EV total cost of ownership.
10. 2026 Outlook & Policy Recommendations
The Stockholm Declaration's target of halving road deaths by 2030 requires reducing annual fatalities from 1.35 million to approximately 675,000 — a reduction of 675,000 deaths per year in just four years. Based on current trajectories, this target will not be met. However, the tools to achieve it exist; what is lacking is political will and funding.
Priority Policy Recommendations for 2026–2030
Implement Safe System road design standards on all national highways in LMICs
Mandate AEB and AVAS on all new vehicles sold globally by 2028
Harmonise blood alcohol limits at 0.05% globally with automated enforcement
Universal helmet laws for motorcyclists with 90%+ compliance targets
Invest $50B globally in pedestrian and cycling infrastructure in urban areas
Strengthen post-crash emergency response systems in LMICs
The economic case for road safety investment is overwhelming. Every $1 invested in road safety returns $4–$10 in economic benefits. The World Bank estimates that achieving the Stockholm Declaration targets would generate $3.1 trillion in economic value over the next decade — equivalent to the entire GDP of the United Kingdom.
Technology offers significant hope. Connected vehicle systems, vehicle-to-infrastructure (V2I) communication, and AI-powered traffic management have the potential to eliminate the human error that causes 94% of crashes. Autonomous vehicles, when they achieve sufficient market penetration, could theoretically reduce road deaths by 90% — though the timeline for this transformation remains uncertain.
In the near term, the most impactful actions are the least glamorous: enforcing existing speed limits, ensuring seatbelt compliance, fixing dangerous road sections, and improving emergency response times. These interventions are proven, cost-effective, and available today.
Road safety is inseparable from the broader question of car ownership costs. A vehicle that is involved in a serious accident imposes costs — financial, physical, and emotional — that dwarf any savings made on purchase price or running costs. Understanding the full picture of car costs, including accident risk, is essential for informed decision-making. Explore our car cost calculator and global car cost data to understand the complete financial picture of car ownership in your country.
References & Citations
- [1] World Health Organization (2023). Global Status Report on Road Safety 2023. Geneva: WHO. who.int
- [2] World Bank (2024). The High Toll of Traffic Injuries: Unacceptable and Preventable. Washington DC: World Bank Group. worldbank.org
- [3] National Highway Traffic Safety Administration (2023). Traffic Safety Facts 2022 Data. Washington DC: NHTSA. crashstats.nhtsa.dot.gov
- [4] International Transport Forum (2025). Road Safety Annual Report 2025. Paris: OECD/ITF. itf-oecd.org
- [5] Global Burden of Disease Collaborative Network (2024). Global Burden of Disease Study 2023 Results. Seattle: IHME. healthdata.org
- [6] Insurance Institute for Highway Safety (2024). Fatality Facts 2023: Overview. Arlington: IIHS. iihs.org
- [7] European Transport Safety Council (2025). Annual Road Safety Performance Index 2025. Brussels: ETSC. etsc.eu
Advertisement