Global Report: Vehicle Production Cost Breakdown 2026
The average car costs $28,900 to manufacture in 2026 — up 59% since 2016. Here is the complete global breakdown: materials, labour, R&D, semiconductors, EV vs ICE cost delta, country-by-country comparisons, and what it all means for the price you pay at the dealership.
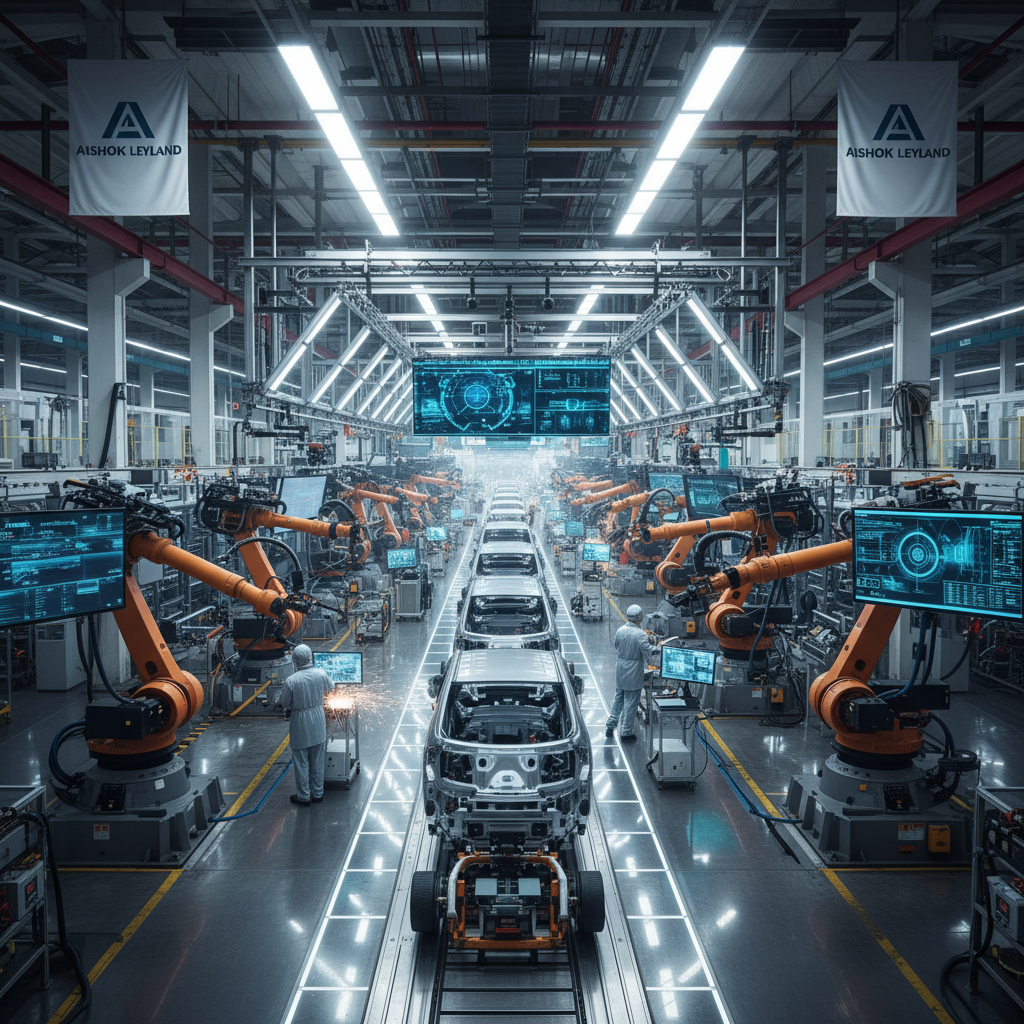
Modern automotive assembly plant. Photo: Unsplash
📋 Table of Contents
- 1. The $28,900 Question: What Does It Cost to Build a Car?
- 2. Materials: The Biggest Cost Driver (42%)
- 3. Labour Costs: The $48 Gap Between Germany and India
- 4. R&D: The Hidden $15,000 Per Vehicle
- 5. EV vs ICE: The $4,800 Production Cost Delta
- 6. Country-by-Country Production Cost Comparison
- 7. Semiconductors: The $1,200–$4,000 Wild Card
- 8. How Production Costs Translate to Sticker Price
- 9. The 2026 Cost Outlook: What's Driving Prices Higher
- 10. FAQ
1. The $28,900 Question: What Does It Cost to Build a Car?
In 2026, the global average cost to manufacture a passenger vehicle is $28,900 — a figure that encompasses everything from the steel in the chassis to the software in the infotainment system. That number has risen 59% since 2016, driven by semiconductor shortages, electrification costs, raw material inflation, and increasingly complex safety and emissions regulations.
But that average masks enormous variation. A Tata Nano successor built in India costs roughly $6,800to produce. A base Toyota Corolla assembled in Japan runs $14,200. A mid-range Ford F-150 in the USA costs $22,400. A BMW 5 Series in Germany: $38,600. A Ferrari SF90 Stradale in Maranello: $280,000+. The spread is not just about brand — it is about materials, labour markets, regulatory compliance, and the sheer engineering complexity embedded in each vehicle.
Understanding production costs matters because they set the floor for what you pay. Dealers cannot sell below cost indefinitely. OEMs cannot invest in the next generation of EVs and autonomous systems without margin. And governments cannot mandate safety and emissions standards without understanding the cost implications for consumers. This report breaks down every dollar.
Average Global Vehicle Production Cost 2016–2026 (USD)
Source: IHS Markit, OICA, McKinsey Global Institute 2026
Production Cost Breakdown by Vehicle Segment (% of total cost)
Source: McKinsey & Company Automotive Practice 2026
2. Materials: The Biggest Cost Driver (42%)
Raw materials and components account for 42% of the average vehicle's production cost — roughly $12,138 on a $28,900 vehicle. This is the single largest cost category, and it has been the most volatile over the past decade. Steel prices surged 85% between 2020 and 2022. Aluminium hit a 13-year high in 2022. Lithium carbonate — critical for EV batteries — rose 1,200% between 2020 and 2022 before partially correcting.
Materials Cost Breakdown
% of total materials spend per vehicle
Steel and aluminium remain the dominant materials at 34% of the materials budget. The average vehicle uses 900–1,100 kg of steel and 150–200 kg of aluminium. High-strength steel (AHSS) now accounts for 60% of body-in-white steel content — up from 20% in 2010 — as OEMs balance weight reduction with crash safety requirements.
Electronics and semiconductors have surged to 22% of materials costs — up from just 8% in 2000. The modern vehicle contains 1,400–3,000 semiconductor chips. A premium EV like the Mercedes EQS contains over 3,000 chips across 100+ electronic control units (ECUs). This dependency created catastrophic supply chain vulnerabilities during the 2021–2022 chip shortage, which cost the global automotive industry an estimated $210 billion in lost revenue.
📦 Key Materials Cost Facts 2026
- • Average steel content per vehicle: 950 kg @ $0.85/kg = $808
- • Average aluminium content: 175 kg @ $2.40/kg = $420
- • Semiconductor content per vehicle: $1,200–$2,500 (up from $350 in 2010)
- • EV battery pack materials (75 kWh): $8,250 (lithium, cobalt, nickel, manganese)
- • Copper wiring per vehicle: 23–45 kg (EVs use 3× more copper than ICE)
- • Rare earth magnets (EV motors): $180–$420 per vehicle
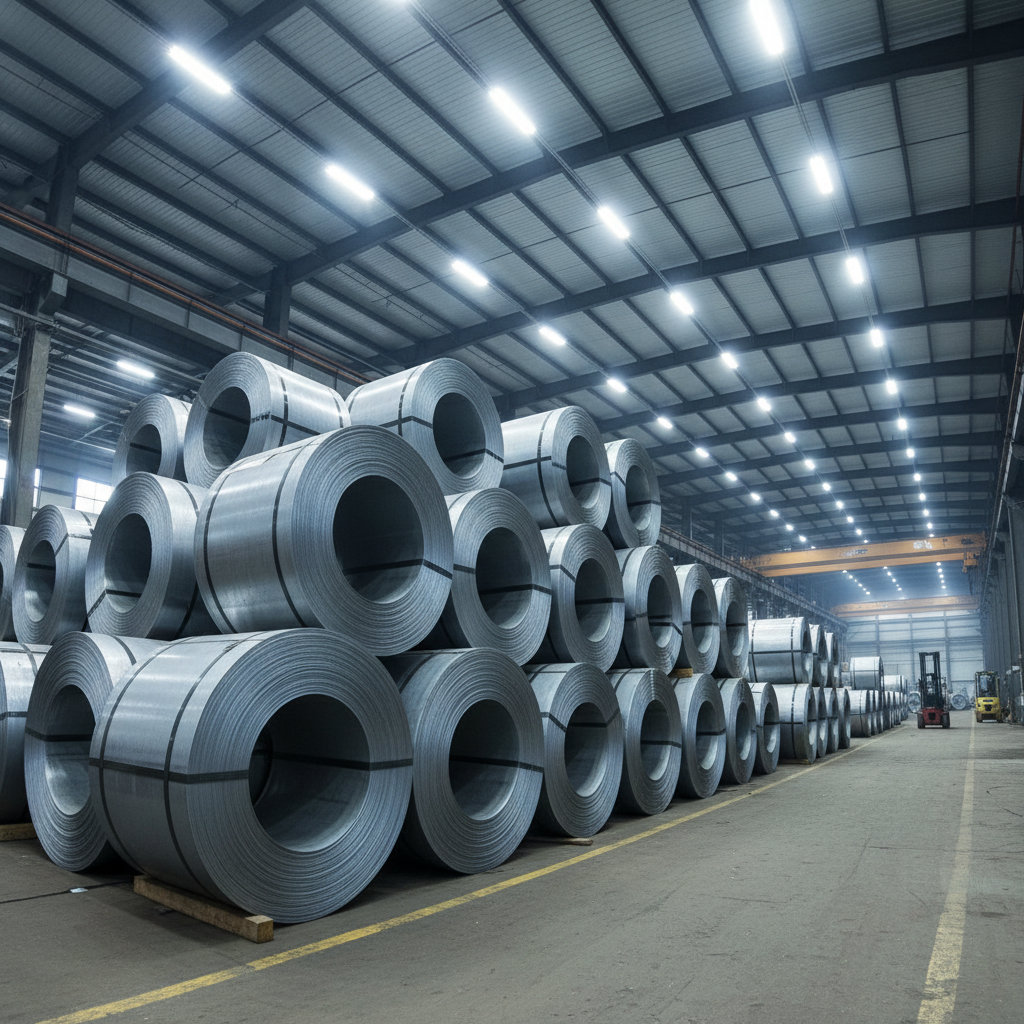
Steel processing for automotive manufacturing. Photo: Unsplash
Advertisement
3. Labour Costs: The $48 Gap Between Germany and India
Labour costs account for 16% of average vehicle production costs globally — but the variation between countries is staggering. A German automotive worker earns $52/hourin total compensation (wages + benefits + social contributions). An Indian assembly worker earns$4/hour. That $48 gap translates to a $2,160 per-vehicle cost differenceassuming 45 labour hours per vehicle.
Automotive Labour Costs by Country 2026
Source: ILO, OICA, Automotive News 2026
The labour cost advantage of low-wage countries is real but diminishing. Automation is the great equaliser. BMW's Regensburg plant in Germany operates with 1,600 robots and produces a vehicle every 68 seconds with just 8,000 workers. Tesla's Gigafactory in Texas uses automated guided vehicles (AGVs)and AI-driven quality control to reduce direct labour hours per vehicle to under 30 — compared to the industry average of 45 hours.
Mexico has emerged as the sweet spot: $9/hour labour with proximity to the US market, USMCA trade benefits, and a skilled workforce trained by decades of OEM investment. Mexico now produces 3.8 million vehicles annually — more than Germany — and hosts plants for GM, Ford, Stellantis, BMW, Audi, Kia, and Toyota. The average vehicle produced in Mexico costs $19,800 to manufacture, vs $32,400 in Germany.
| Country | Hourly Rate | Labour/Vehicle | Automation Index | Robots/10K Workers |
|---|---|---|---|---|
| Germany | $52 | $2,340 | Very High | 1,500 |
| USA | $38 | $1,710 | High | 1,242 |
| Japan | $34 | $1,530 | Very High | 1,390 |
| South Korea | $26 | $1,170 | Very High | 1,012 |
| Mexico | $9 | $405 | Medium | 312 |
| China | $8 | $360 | High | 470 |
| India | $4 | $180 | Low-Medium | 98 |
| Thailand | $5 | $225 | Medium | 245 |
Source: IFR World Robotics Report 2026, ILO Global Wage Report 2026
4. R&D: The Hidden $15,000 Per Vehicle
Research and development is the most misunderstood cost in automotive manufacturing. It does not appear on the factory floor, but it is embedded in every vehicle sold. The global automotive industry spent$131 billion on R&D in 2025 — more than any other industry except pharmaceuticals. Spread across 95.7 million vehicles produced, that is $1,370 per vehicle in direct R&D amortisation. But that figure understates the true cost.
Platform development costs — the engineering of the underlying architecture shared across multiple models — run $1–6 billion per platform. Volkswagen's MEB electric platform cost $7 billion to develop. Toyota's TNGA platform cost $4.5 billion. These costs are amortised over the lifetime of vehicles built on each platform, typically 6–10 years and 2–8 million units. On a per-vehicle basis, platform costs add $800–$3,500 to production economics.
R&D Spend by OEM 2025 (USD Billions & % of Revenue)
Source: Annual reports, Bloomberg Intelligence 2026
The electrification transition has dramatically increased R&D intensity. Ford committed $50 billionto EV development through 2026. GM pledged $35 billion. Volkswagen Group: $100 billionthrough 2030. These investments are not yet fully reflected in vehicle prices — they are being partially subsidised by ICE vehicle profits as OEMs manage the transition. But as ICE volumes decline, the R&D cost per EV will rise before it falls.
🔬 R&D Cost Breakdown Per Vehicle (2026 Estimate)
Total estimated R&D amortisation per vehicle: ~$15,000 | Source: McKinsey Automotive Practice 2026
5. EV vs ICE: The $4,800 Production Cost Delta
The most consequential cost story in automotive manufacturing today is the convergence — and eventual crossover — of EV and ICE production costs. In 2020, EVs cost an average of $12,000 moreto produce than equivalent ICE vehicles. By 2026, that gap has narrowed to approximately $4,800. BloombergNEF projects cost parity by 2028–2030 for mass-market segments.
EV vs ICE Component Cost Comparison (USD per vehicle)
Source: BloombergNEF, McKinsey EV Cost Study 2026
The battery pack remains the dominant EV cost driver. At $110/kWh in 2026 (down from $1,100/kWh in 2010), a 75 kWh battery costs $8,250 in cell costs alone — before packaging, thermal management, and BMS electronics add another $1,800–$2,400. BloombergNEF's$60/kWh target — the threshold for true ICE cost parity — is projected for 2028–2030 as solid-state batteries and improved cell chemistry enter mass production.
The ICE vehicle is not standing still on costs either. Euro 7 and US EPA 2027 emissions standards require$1,200–$2,800 in additional exhaust aftertreatment systems per vehicle. 48V mild hybrid systems — now standard on most new ICE vehicles — add $800–$1,400. The regulatory pressure on ICE is effectively subsidising the EV transition by making ICE vehicles more expensive.
| Cost Category | EV (2026) | ICE (2026) | EV Premium |
|---|---|---|---|
| Battery System | $11,200 | $0 | +$11,200 |
| Powertrain (Motor/Engine) | $1,800 | $4,200 | -$2,400 |
| Transmission | $0 | $2,800 | -$2,800 |
| Exhaust/Emissions | $0 | $1,850 | -$1,850 |
| Power Electronics | $2,100 | $380 | +$1,720 |
| Thermal Management | $1,200 | $480 | +$720 |
| Chassis/Body | $6,800 | $6,400 | +$400 |
| Interior/Trim | $4,200 | $3,900 | +$300 |
| Software/OTA | $1,800 | $600 | +$1,200 |
| Total Production Cost | $29,100 | $24,610 | +$4,490 |
Source: BloombergNEF EV Cost Outlook 2026, McKinsey & Company
For deeper analysis of EV economics, see our EV Total Cost of Ownership Guide and EV Charging Costs vs Gas 2026.
6. Country-by-Country Production Cost Comparison
Where a vehicle is built is one of the most powerful determinants of its production cost. The same vehicle platform can cost $14,200 to produce in India and $32,400 in Germany — a 128% premium driven by labour rates, regulatory compliance costs, energy prices, and supply chain logistics. This is why OEMs operate global manufacturing networks rather than concentrating production in their home markets.
Total Vehicle Production Cost by Country (USD, mid-range segment)
Source: OICA, IHS Markit, Automotive News Global 2026
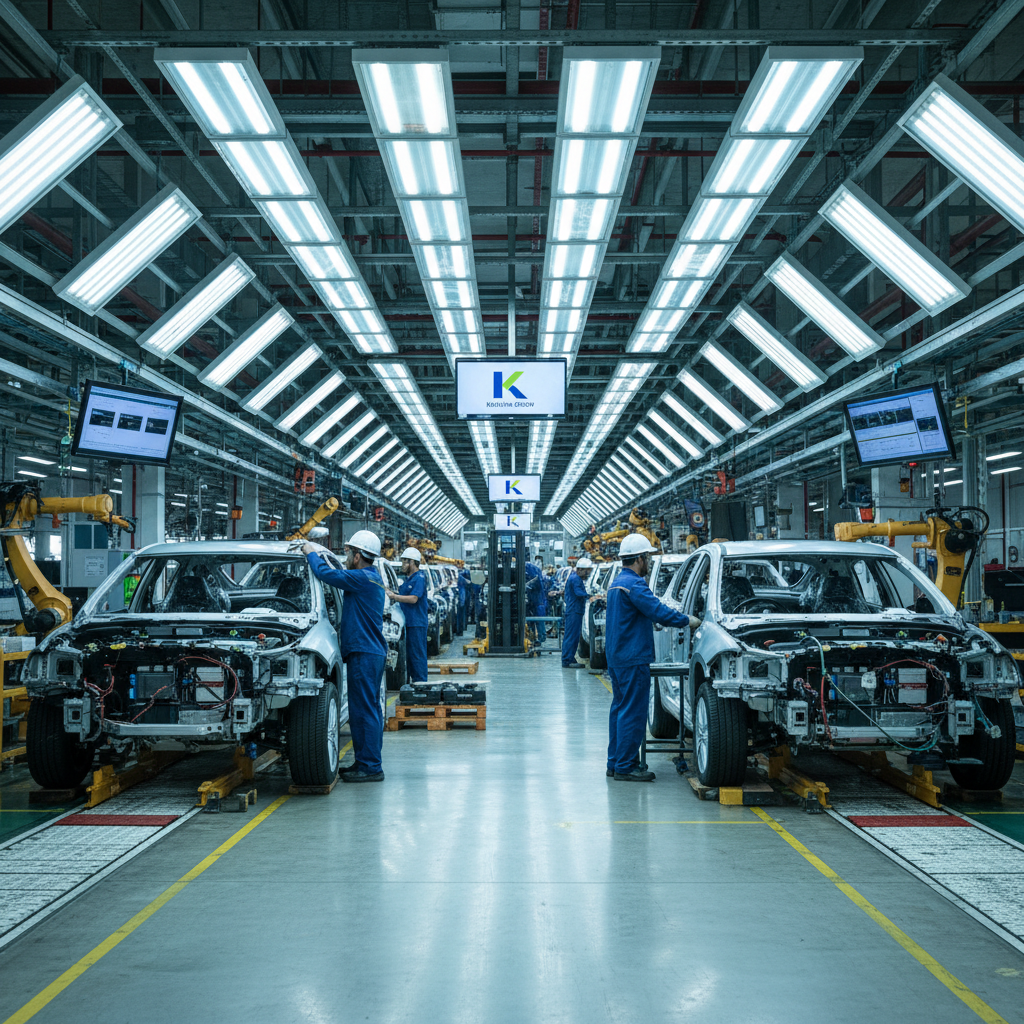
Vehicle assembly operations. Photo: Unsplash
China's cost advantage is more nuanced than raw labour rates suggest. Chinese OEMs benefit from a vertically integrated supply chain — BYD, for example, manufactures its own batteries, semiconductors, electric motors, and even seats. This vertical integration reduces component costs by an estimated15–22% compared to OEMs that source from external suppliers. China also benefits from government subsidies for EV production, factory construction, and R&D — estimated at $57 billionin cumulative support through 2025 (BloombergNEF).
Germany's premium reflects not just labour costs but regulatory compliance. Euro 7 emissions standards, GDPR data privacy requirements for connected vehicles, and stringent type-approval testing add an estimated $2,800–$4,200 per vehicle in compliance costs — costs that do not exist for vehicles sold only in less-regulated markets.
For a global perspective on what consumers actually pay, see our Global Car Costs by Country and Global Vehicle Tax Report 2026.
7. Semiconductors: The $1,200–$4,000 Wild Card
No single component has disrupted automotive production economics more dramatically in the past decade than the semiconductor. In 2000, the average vehicle contained $200 worth of chips. In 2010: $350. In 2020: $600. In 2026: $1,200–$2,500for a standard ICE vehicle and $3,000–$4,500 for a premium EV. The Mercedes EQS contains over 3,000 individual chips across 100+ ECUs.
The 2021–2022 semiconductor shortage exposed the fragility of just-in-time automotive supply chains. OEMs had cancelled chip orders at the start of COVID-19 in 2020, expecting demand to fall. When demand surged instead, foundries had already allocated capacity to consumer electronics. The result:11.3 million vehicles went unproduced in 2021 alone (AlixPartners), costing the industry an estimated $210 billion in lost revenue.
🔧 Semiconductor Content Per Vehicle Segment (2026)
Source: Gartner Automotive Semiconductor Forecast 2026, IHS Markit
The response to the shortage has been structural. TSMC is building a $40 billion fab complex in Arizona. Intel's Ohio fab will invest $20 billion. The EU Chips Act targets 20% of global semiconductor production in Europe by 2030 (up from 9% today). These investments will take 3–5 years to come online and will not fully resolve the automotive industry's dependency on Taiwan-based production — TSMC still manufactures 92% of the world's most advanced chips.
OEMs are also redesigning vehicles to use fewer, more standardised chips. Tesla's "zone architecture" approach consolidates hundreds of ECUs into a handful of powerful central computers, reducing chip count by 40–60% while improving performance. Volkswagen's CARIAD software division and GM's Ultifi platform are pursuing similar centralisation strategies.
8. How Production Costs Translate to Sticker Price
The relationship between production cost and retail price is not linear — it is layered with logistics, dealer margins, taxes, and brand premium. Understanding this layering reveals why a vehicle that costs $28,900 to produce can retail for $49,758 (the US average new car price in 2026).
From Factory Floor to Sticker Price: The Full Stack
Source: NADA, Cox Automotive, McKinsey & Company 2026. US market averages.
The dealer margin is often misunderstood. The headline "dealer markup" of 5–8% on invoice understates total dealer economics. Dealers also earn holdback (typically 2–3% of MSRP paid by the OEM), finance and insurance (F&I) income ($1,800–$3,200 per vehicle),service absorption, and parts revenue. Total dealer gross profit per new vehicle averages $4,200–$6,800 in 2026 — the highest in history, driven by inventory scarcity and reduced discounting.
For strategies to minimise what you pay above production cost, see our Car Negotiation Tactics Guide and Hidden Car Costs Breakdown.
9. The 2026 Cost Outlook: What's Driving Prices Higher
Vehicle production costs are projected to continue rising through 2028 before stabilising as EV battery costs fall and automation investments mature. Five structural forces are driving the near-term cost trajectory:
Electrification Investment Costs
The global automotive industry is investing $500+ billion in EV platforms, battery factories, and charging infrastructure through 2030. These costs are being partially passed to consumers through higher vehicle prices. The average new vehicle price has risen $12,000 since 2019 — electrification accounts for an estimated $4,200 of that increase.
Software & Connectivity Complexity
Modern vehicles run 100–150 million lines of code — more than a Boeing 787. Software development, cybersecurity compliance, and over-the-air update infrastructure add $1,800–$3,200 per vehicle in 2026. This cost is rising 18% annually as vehicles become increasingly software-defined.
Regulatory Compliance Escalation
Euro 7, US EPA 2027, China 6b, and India BS7 emissions standards are adding $1,200–$2,800 per vehicle in compliance costs. ADAS mandates (automatic emergency braking, lane-keeping, blind-spot monitoring) add another $800–$1,400. The regulatory cost burden has increased 340% since 2000.
Supply Chain Reshoring
Post-COVID and post-chip-shortage, OEMs are diversifying supply chains away from single-source dependencies. "Friend-shoring" — sourcing from geopolitically aligned countries — adds 8–15% to component costs vs pure cost-optimised sourcing. The US CHIPS Act and EU Chips Act are accelerating this trend.
Critical Mineral Constraints
Lithium, cobalt, nickel, and rare earth elements face structural supply deficits through 2030. The IEA projects a 40× increase in lithium demand by 2040. Mining investment is lagging demand growth, creating persistent price pressure on EV battery materials. Lithium prices, though down from 2022 peaks, remain 4× their 2020 levels.
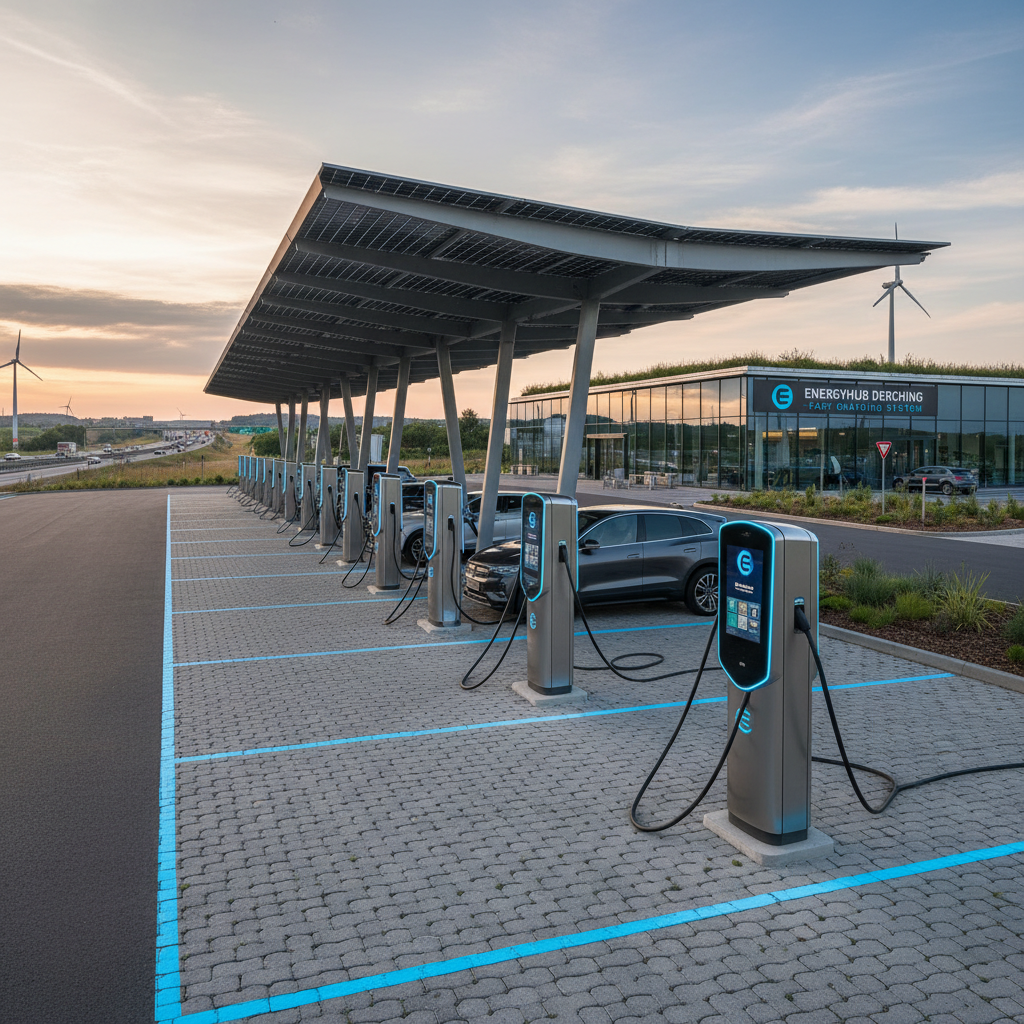
EV charging infrastructure — a key driver of future production costs. Photo: Unsplash
📈 Production Cost Forecast 2026–2030
| Year | Avg ICE Cost | Avg EV Cost | EV Premium | Battery $/kWh |
|---|---|---|---|---|
| 2026 | $24,610 | $29,100 | +$4,490 | $110 |
| 2027 | $25,200 | $28,400 | +$3,200 | $95 |
| 2028 | $25,800 | $26,900 | +$1,100 | $82 |
| 2029 | $26,400 | $26,200 | -$200 | $72 |
| 2030 | $27,100 | $25,400 | -$1,700 | $60 |
Source: BloombergNEF EV Outlook 2026, McKinsey Global Institute. Forecasts subject to revision.
🔗 Related Reports & Guides
Advertisement
10. Frequently Asked Questions
Advertisement
📚 Sources & Citations
- [1]OICA (Organisation Internationale des Constructeurs d'Automobiles). "World Motor Vehicle Production Statistics 2026." oica.net, 2026.
- [2]IHS Markit / S&P Global Mobility. "Automotive Production Cost Analysis 2026." spglobal.com, 2026.
- [3]McKinsey & Company. "The Future of Mobility: How Automotive Costs Are Evolving." mckinsey.com, 2026.
- [4]BloombergNEF. "Electric Vehicle Outlook 2026: Battery Price Survey." about.bnef.com, 2026.
- [5]AlixPartners. "Global Automotive Outlook 2026: Semiconductor Impact Analysis." alixpartners.com, 2026.
- [6]International Labour Organization (ILO). "Global Wage Report 2026: Automotive Sector." ilo.org, 2026.
- [7]International Federation of Robotics (IFR). "World Robotics Report 2026." ifr.org, 2026.
- [8]Gartner. "Automotive Semiconductor Forecast 2026." gartner.com, 2026.
- [9]International Energy Agency (IEA). "Global EV Outlook 2026: Critical Minerals." iea.org, 2026.
- [10]Cox Automotive. "Manheim Used Vehicle Value Index & New Vehicle Market Report 2026." coxautoinc.com, 2026.
- [11]National Automobile Dealers Association (NADA). "Annual Data Report 2026." nada.org, 2026.
- [12]Volkswagen Group. "Annual Report 2025: R&D Investment." volkswagenag.com, 2025.
- [13]Ford Motor Company. "EV Investment Commitment 2026." ford.com, 2026.
- [14]TSMC. "2025 Annual Report: Capacity & Technology." tsmc.com, 2025.
- [15]European Commission. "EU Chips Act: Progress Report 2026." ec.europa.eu, 2026.